IoT platform for analyzing sunlight distribution in greenhouses through a sensor network, heat maps, and real-time data.
Description
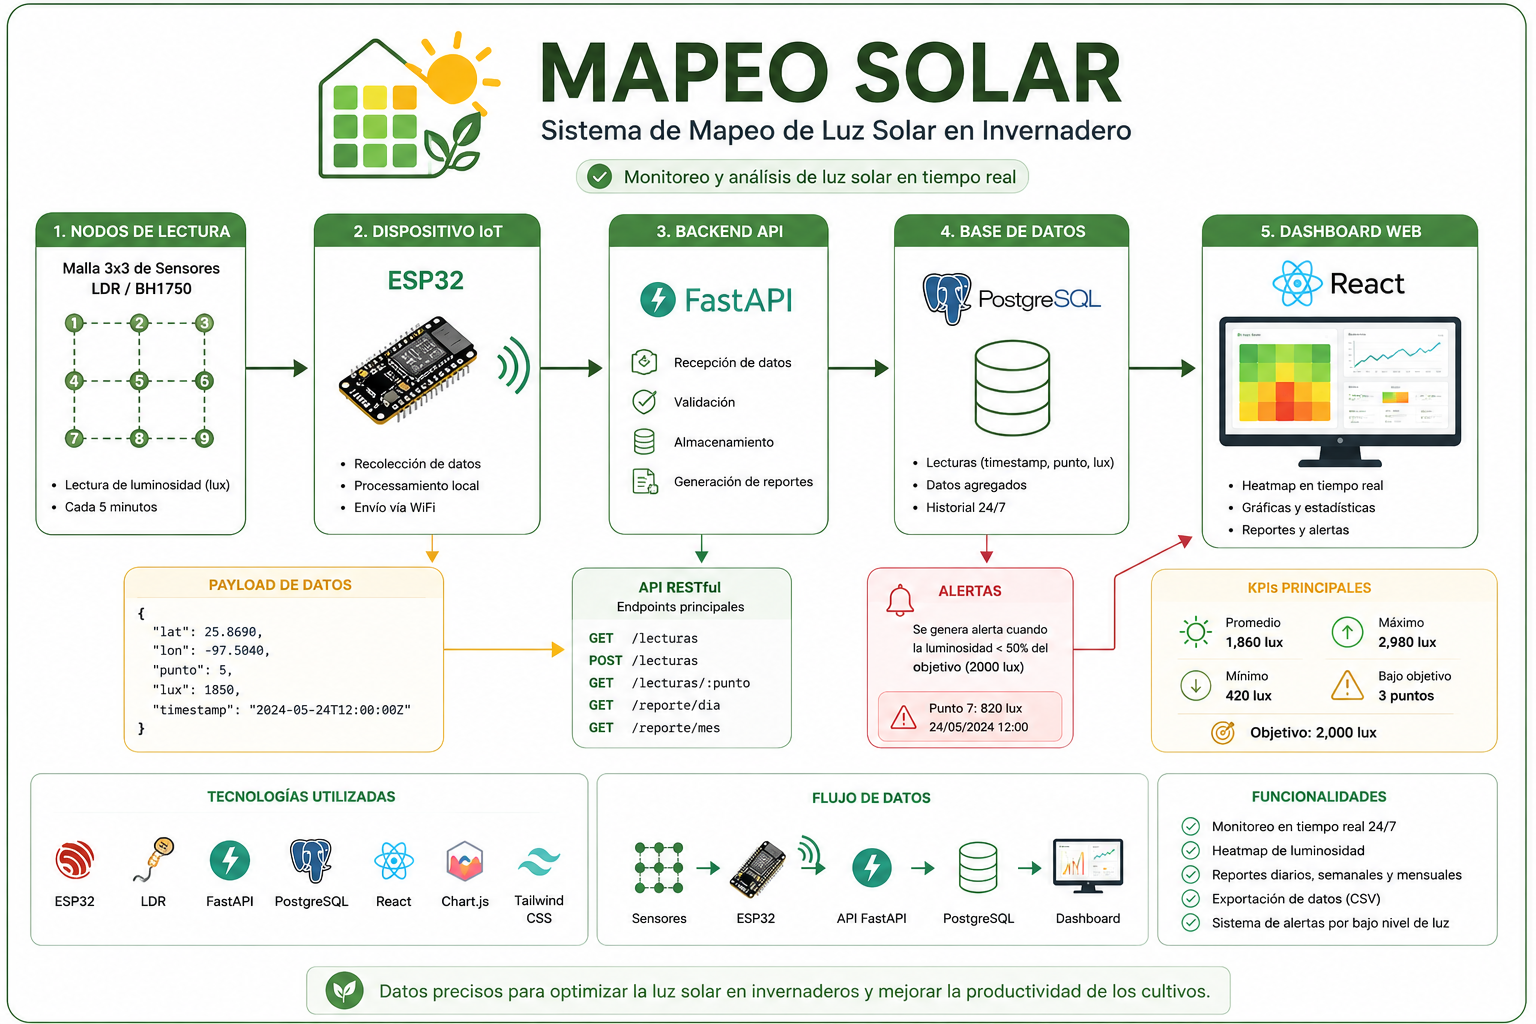
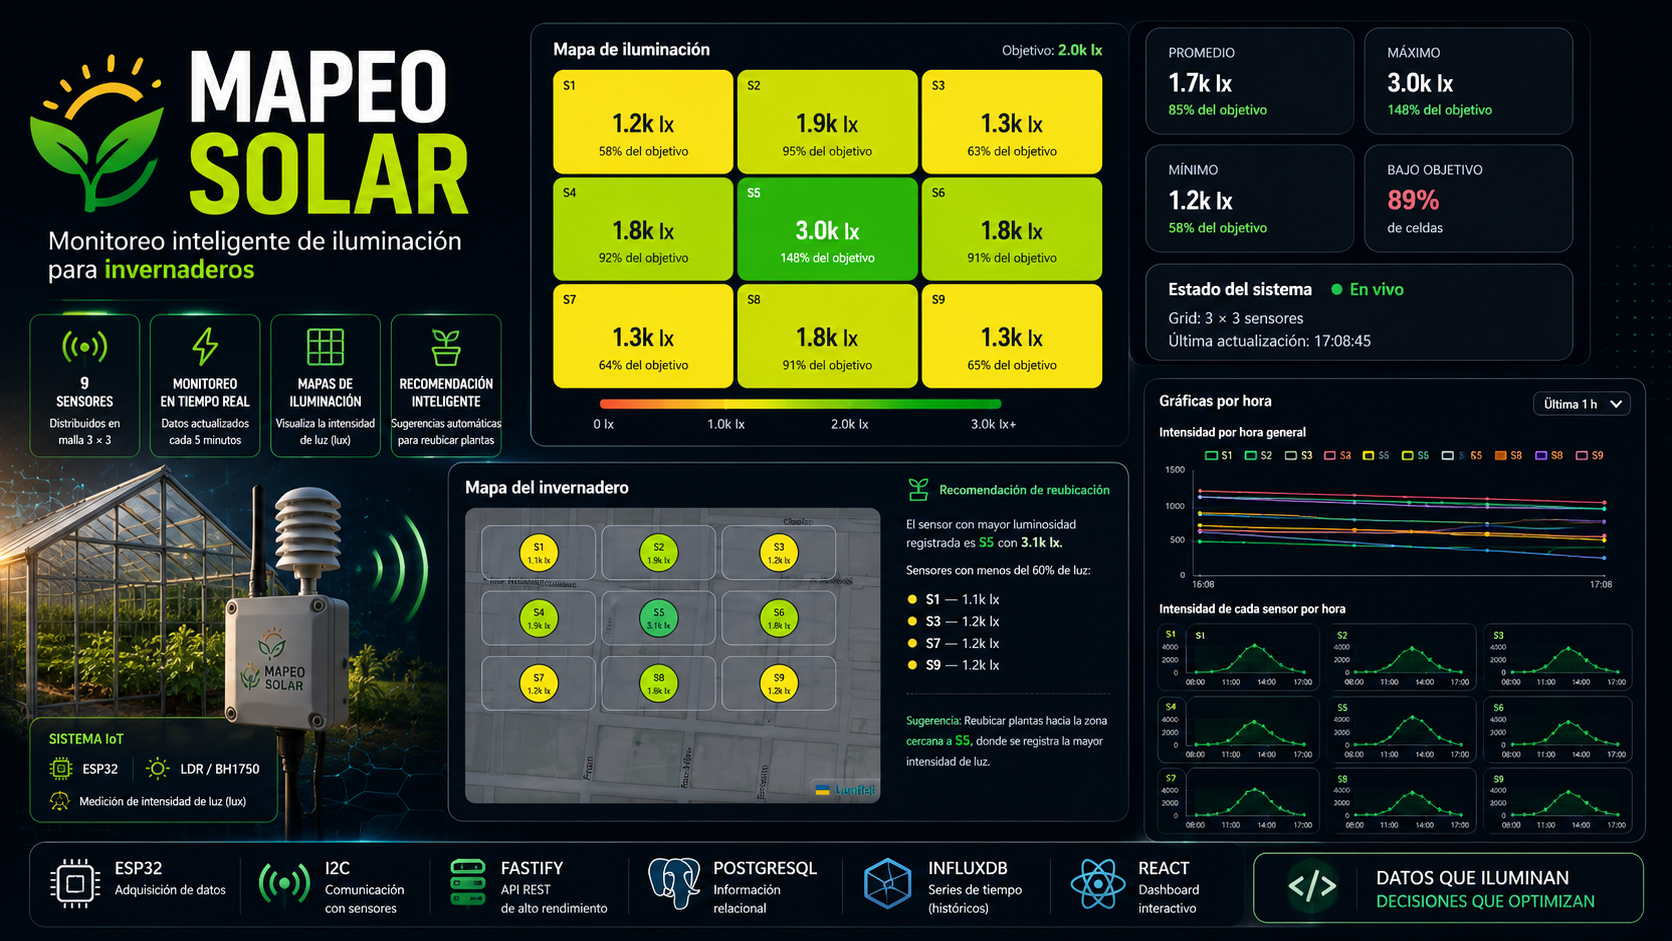
The Solar Mapping Platform for Greenhouses is an IoT system designed to measure and analyze light distribution inside a greenhouse. A nine-sensor grid collects illuminance readings that are processed by an ESP32, stored through an API, and displayed on a web dashboard.
My role
As a Full Stack Developer, I designed and developed the platform responsible for receiving, validating, storing, and visualizing measurements collected by the sensor network.
- Developed the REST API with FastAPI to receive and query readings.
- Designed the PostgreSQL structure for measurements organized by point and timestamp.
- Built the React dashboard with heat maps, charts, and statistics.
- Implemented daily and monthly reports, data exports, and alerts.
- Participated in integrating the ESP32 with the LDR/BH1750 sensor grid.
Key features
- Illuminance readings through a 3 × 3 sensor grid.
- Data collection and Wi-Fi transmission with ESP32.
- Validation and storage through a FastAPI REST API.
- Illuminance heat maps updated on the dashboard.
- Average, maximum, and minimum value statistics.
- Measurement history and daily, weekly, and monthly reports.
- CSV data export.
- Alerts when a sensor point falls below the lighting target.
Impact
The platform helps identify areas with different sunlight exposure levels inside the greenhouse. This information can support crop placement, environmental analysis, and decisions related to precision agriculture.
Project flow